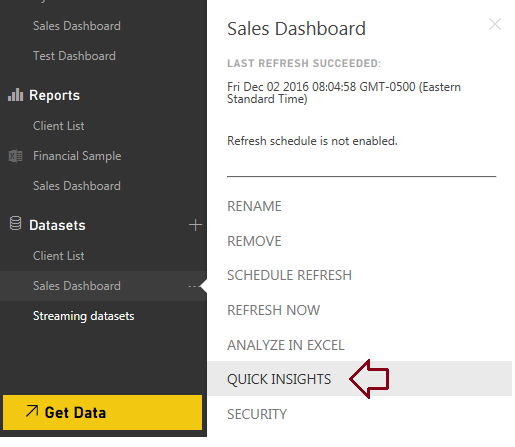
Quick Insights is a unique feature of Power BI that uses Machine Learning Algorithms to search for patterns, trends, and correlations in data, and provides a list of insights in the form of visuals. These insights (visuals) can be saved by pinning them to a dashboard. To run Quick Insights on your dataset, click on the ellipsis next to your dataset and then select View Insights as shown below.
Power BI will run Machine Learning Algorithms on your dataset to look for correlations, outliers, trends, patterns, etc. and a notification pops up at the top right-hand corner indicating that the insights are ready. This process might take some time depending on the size of the dataset.


If you like a particular insight, you can save the visual by pinning the visual to a (new or existing) dashboard. Another interesting thing to note here is that Power BI lets us run Quick Insights on each of these visuals individually. For example, if I click on the first visual produced by Quick Insights (the visual will open in focus mode), there is an option called Get Insights on the top right corner as shown in the screenshot below.

If I click on Get Insights, Power BI will run the Machine Learning Algorithms again, but this time, it just focuses on the fields used in this particular visual. As shown in the screen shot below, the algorithms produced a quick summary of the existing visual and a list of new insights based on the fields used in the current visual.

I can click on any of these new visuals and get new insights from them (insights from insights) and continue this process. The option to run Quick Insights is also available for individual tiles in a dashboard — just click on the “focus mode” option on the tile to open in focus mode, and you’ll see the option Get Insights on the top right corner.
I hope this helps; please use comments if you have any questions.

Thanks for writing this in-depth post. You covered every angle. The great thing is you can reference different parts.Enroll with Power BI online Training
ReplyDeletePower BI Online Training
Thanks for sharing this valuable information to our vision. Power BI Online Online course Bangalore
ReplyDeleteThanks for sharing. IntelliMindz is the best IT Training in Bangalore with placement, offering 200 and more software courses with 100% Placement Assistance.
DeletePower BI Online Training
Power BI Course In Bangalore
Power BI Training In Chennai
The article is very easy to under stand Power BI Online Training Hyderabad
ReplyDeletethank you for sharing.Power BI Online Training
ReplyDeleteThis comment has been removed by the author.
ReplyDeleteNice Info Thanks For Sharing Power Bi Training In Hyderabad
ReplyDeleteI think there is a need to look for some more information about Power BI and its related aspects.Power BI is amongst the most easy tool to handle extreme complex IT problems.
ReplyDeleteQlik Rest Api Connection
Thank you so much for these kinds of informative blogs.We are also a digital marketing company in gurgaon and we provide the website design services,
ReplyDeleteweb development services, e-commerce development services.
website designer in noida
website designers delhi
website designers in delhi
website designing agency in delhi
website designing and development
website designing companies in delhi
website designing company delhi
website designing company in delhi ncr
website designing company in gurgaon
website designing company in new delhi
website designing company in noida
website designing company list
website designing company noida
website designing cost in delhi
website designing cost in india
website designing delhi
website designing firms in delhi
website designing in delhi
website designing in delhi ncr
website designing in gurgaon
website designing in noida
website designing services
website designing services delhi
website designing services in delhi
web design development company
web design development services
web design in delhi
web design service
web design services company
web design services in delhi
web designer company
web designer delhi
web designer in delhi
web designers delhi
web designers in delhi
web designing & development
web designing advertisement
web designing and development
web designing and development company
web designing and development services
Very nice article,keep sharing it.
ReplyDeleteThank you...
Power BI Training
ANALYTICS TRAINING HUB is a journey of humble beginnings with the sole focus aimed at equipping our clients with the necessary training & support to aid in educating them in multiple distinct data analytic tools courses in Delhi and ncr. we can provide our clients an in-depth knowledge of some of the world-renowned data analytic tools like Power BI, Tableau, QlikView, MS Excel, Python, R etc, which enables us to live up to the vision of our firm while making our clients efficient & capable.
ReplyDeleteMIS Training in Delhi
Microsoft Excel Course
MySQL Course in Delhi ncr
Excel VBA and Macros Course in Delhi
Power BI Course in Delhi
Tableau Course in Delhi
First You got a great blog .I will be interested in more similar topics.I commend you for your excellent report on the knowledge that you have shared in this blog.
ReplyDeleteBest & Free Tool For Content Creators
Create Presentations Online Free
Django training online helps learners gain backend expertise remotely.It focuses on practical coding tasks.Hands-on work improves mastery.This Django training online supports self-paced learning.It is effective.
ReplyDelete