Saturday, December 10, 2016

Power BI - Analyze in Excel

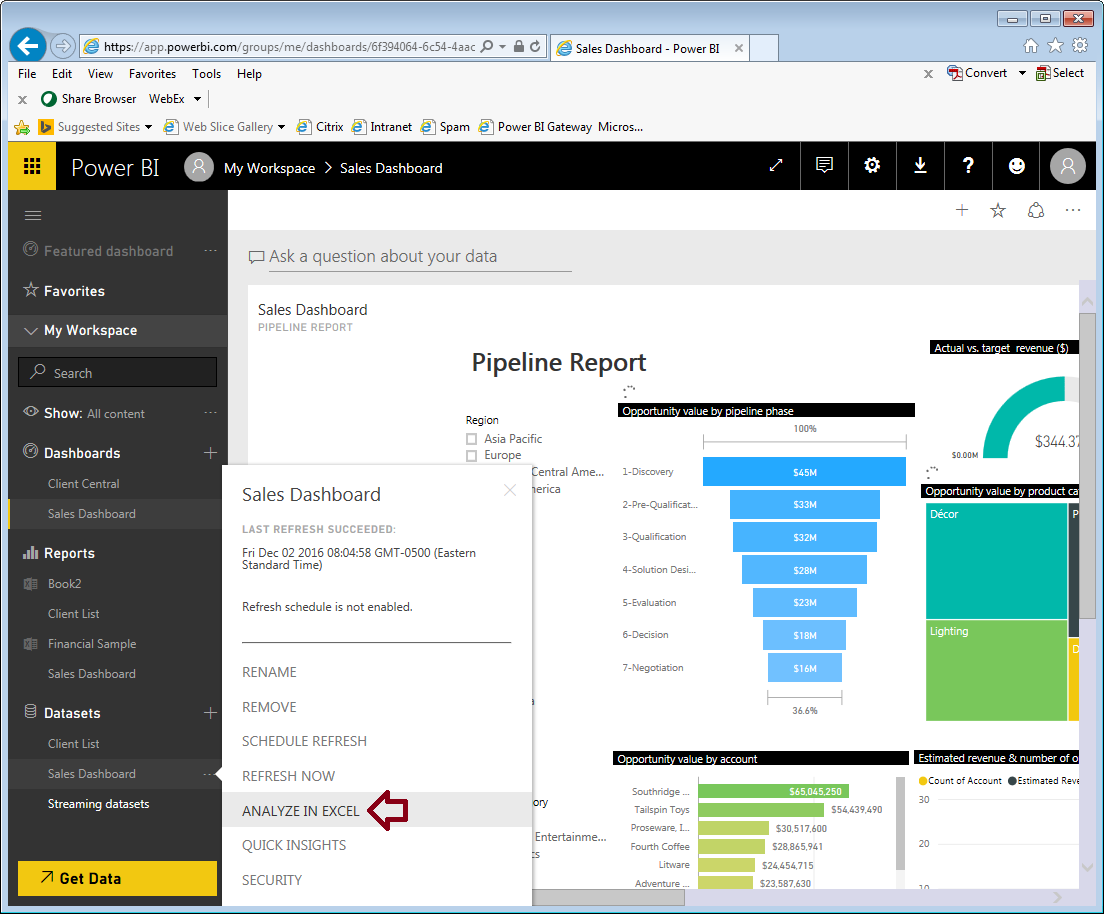
Analyze in Excel is an interesting feature of Power BI (Power BI Service, to be specific) that lets users analyze and explore Power BI data models using Excel. In other words, the datasets that we publish to Power BI Service can be analyzed using Excel (requires Excel 2010 SP1 and later). To get started with this feature, click on the ellipsis next to your dataset, and click on the option ‘Analyze in Excel’ as shown in the screen shot below.


Power BI will download a connection to this dataset in the form of an office data connection (odc) file. 


Click open to open up your dataset in an Excel PivotTable, which exposes all the data points in your data model. You can slice and dice anything by pretty much any field you have in your data model. As you are analyzing the data, the Excel PivotTable will be pulling data from the data model hosted in the cloud (Power BI Service). Please note that the PivotTable in this case won’t let you define aggregation on numeric fields other than what you've already defined in the Power BI dataset. For example, if there is a numeric field in the dataset, you won’t be able to place it under "VALUES" section of the PivotTable to aggregate it if you haven’t defined the aggregation on that field in the Power BI dataset.

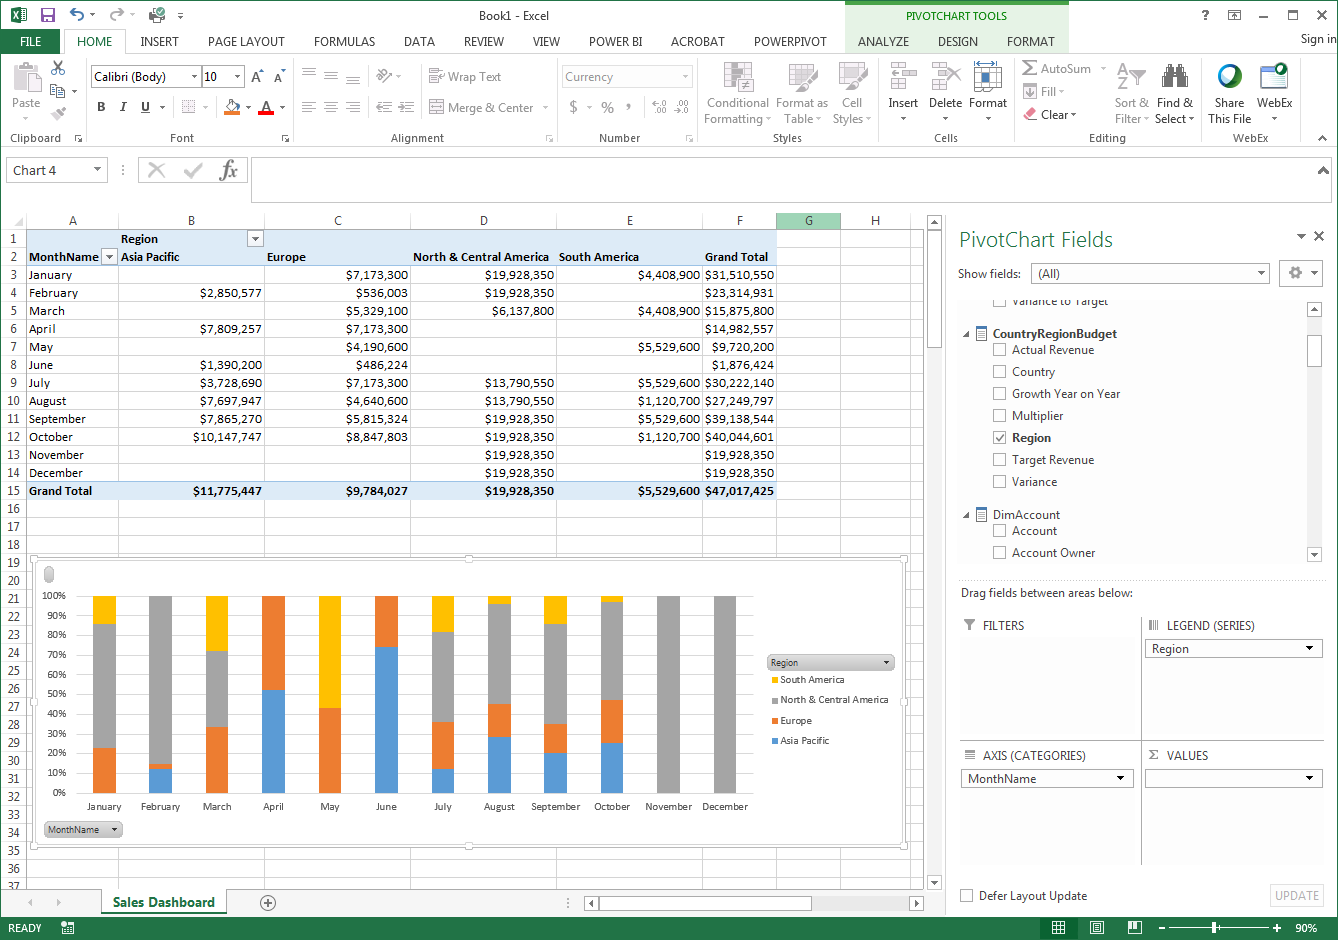
Once you have your report ready, you can save it anywhere you like or share it with other users. You can also publish the Excel report back to Power BI Service, however, it will be uploaded as a static Excel file without any interactivity or ability to refresh data, etc. Below is a  screenshot of a sample report created using Analyze in Excel.


I hope this is helpful, please leave a comment if you have a question.

Sunday, December 4, 2016

Quick Insights In Power BI

Quick Insights is a unique feature of Power BI that uses Machine Learning Algorithms to search for patterns, trends, and correlations in data, and provides a list of insights in the form of visuals. These insights (visuals) can be saved by pinning them to a dashboard. To run Quick Insights on your dataset, click on the ellipsis next to your dataset and then select View Insights as shown below.


Power BI will run Machine Learning Algorithms on your dataset to look for correlations, outliers, trends, patterns, etc. and a notification pops up at the top right-hand corner indicating that the insights are ready. This process might take some time depending on the size of the dataset.


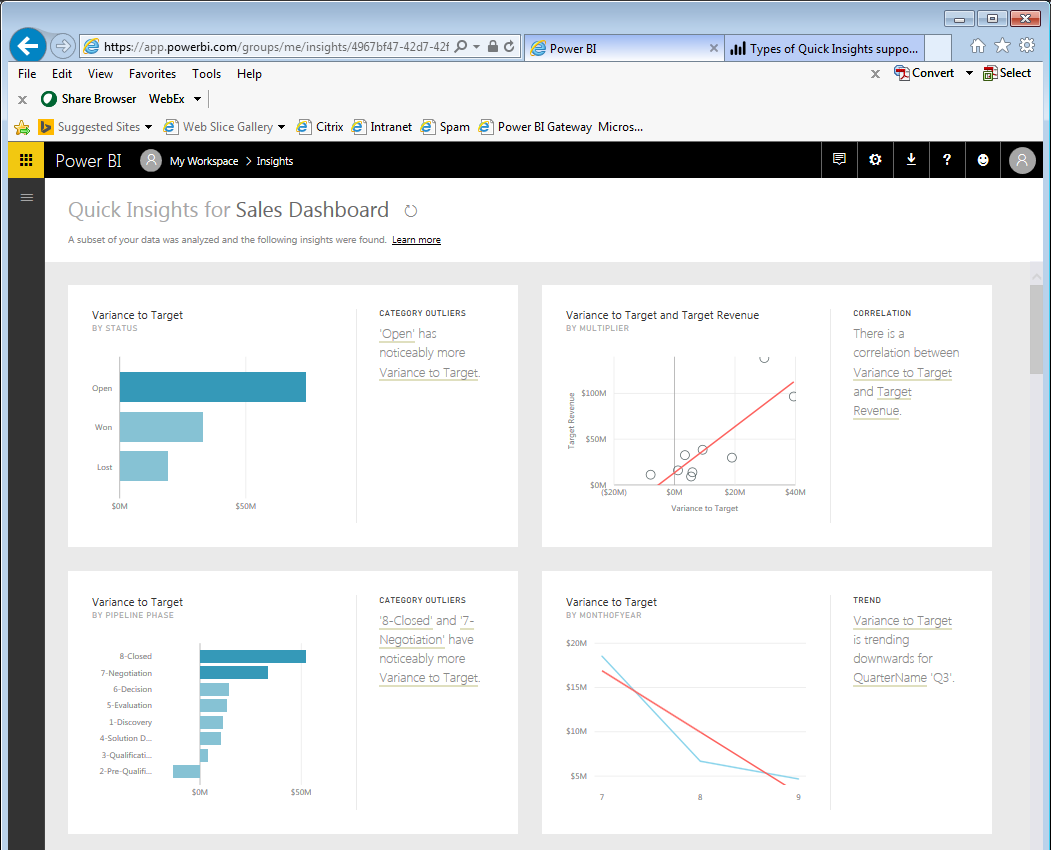
 Clicking on the View Insights button will show all the visualizations that were put together by the algorithms, as shown in the screenshot below.


If you like a particular insight, you can save the visual by pinning the visual to a (new or existing) dashboard. Another interesting thing to note here is that Power BI lets us run Quick Insights on each of these visuals individually. For example, if I click on the first visual produced by Quick Insights (the visual will open in focus mode), there is an option called Get Insights on the top right corner as shown in the screenshot below.


 If I click on Get Insights, Power BI will run the Machine Learning Algorithms again, but this time, it just focuses on the fields used in this particular visual. As shown in the screen shot below, the algorithms produced a quick summary of the existing visual and a list of new insights based on the fields used in the current visual.


I can click on any of these new visuals and get new insights from them (insights from insights) and continue this process. The option to run Quick Insights is also available for individual tiles in a dashboard just click on the “focus mode” option on the tile to open in focus mode, and you’ll see the option Get Insights on the top right corner. 

I hope this helps; please use comments if you have any questions.

Saturday, November 26, 2016

Power BI Content Packs

What are Power BI Content Packs?
For popular SaaS applications like SalesForce, Dynamics 365, Google Analytics, etc., Microsoft has built a collection of data models, dashboards, and reports and made them available for Power BI users to consume. This pre-packaged collection of data models, dashboards, and reports is called Content Pack. Simply put, Content Packs provide out-of-the-box connectors to popular SaaS applications with a prebuilt data model, reports, and dashboards; these dashboards and reports can be customized (“personalized”) if required to fit our own requirements. In just a matter of a few minutes, you can use content packs to get immediate insights into my data. Another great thing about content packs is that you do not require Power BI Pro to be able to use them (Power BI Free can be used).

Limitations of content packs
The following are some of the limitations of content packs:
1. Generic: Content packs are generic in the sense that they only include standard entities from the SaaS applications. For example, if you are using Dynamics 365 CRM content pack, you’ll find that it only includes the standard, out-of-the-box entities from your CRM system – any custom entities/tables from your CRM system are not included.
2. Lack of extensibility: Content packs are not customizable. The reports, dashboards in the content packs can be customized but the data model can’t be modified. For example, if you are using Dynamics 365 CRM Content Pack and you want to add custom entities from your CRM, you are out of luck.
Update – Microsoft recently published an article that explains how to customize Dynamics 365 Content Packs - Customize Microsoft Dynamics 365 Power BI content packs

You can get around these limitations by creating your own content packs and sharing them with your co-workers - these are called Organizational Content Packs. The main difference between the “standard” content packs from Microsoft and the organizational content packs is that the standard content packs are built by Microsoft (soup to nuts), whereas the organizational content packs are something we’ll have to create on our own, from scratch. Organizational content packs require Power BI Pro (paid license).

Accessing/consuming content packs
The standard content packs provided by Microsoft can only be accessed using Power BI Service (they are NOT accessible using Power BI Desktop). Follow these steps to connect to/consume a content pack.

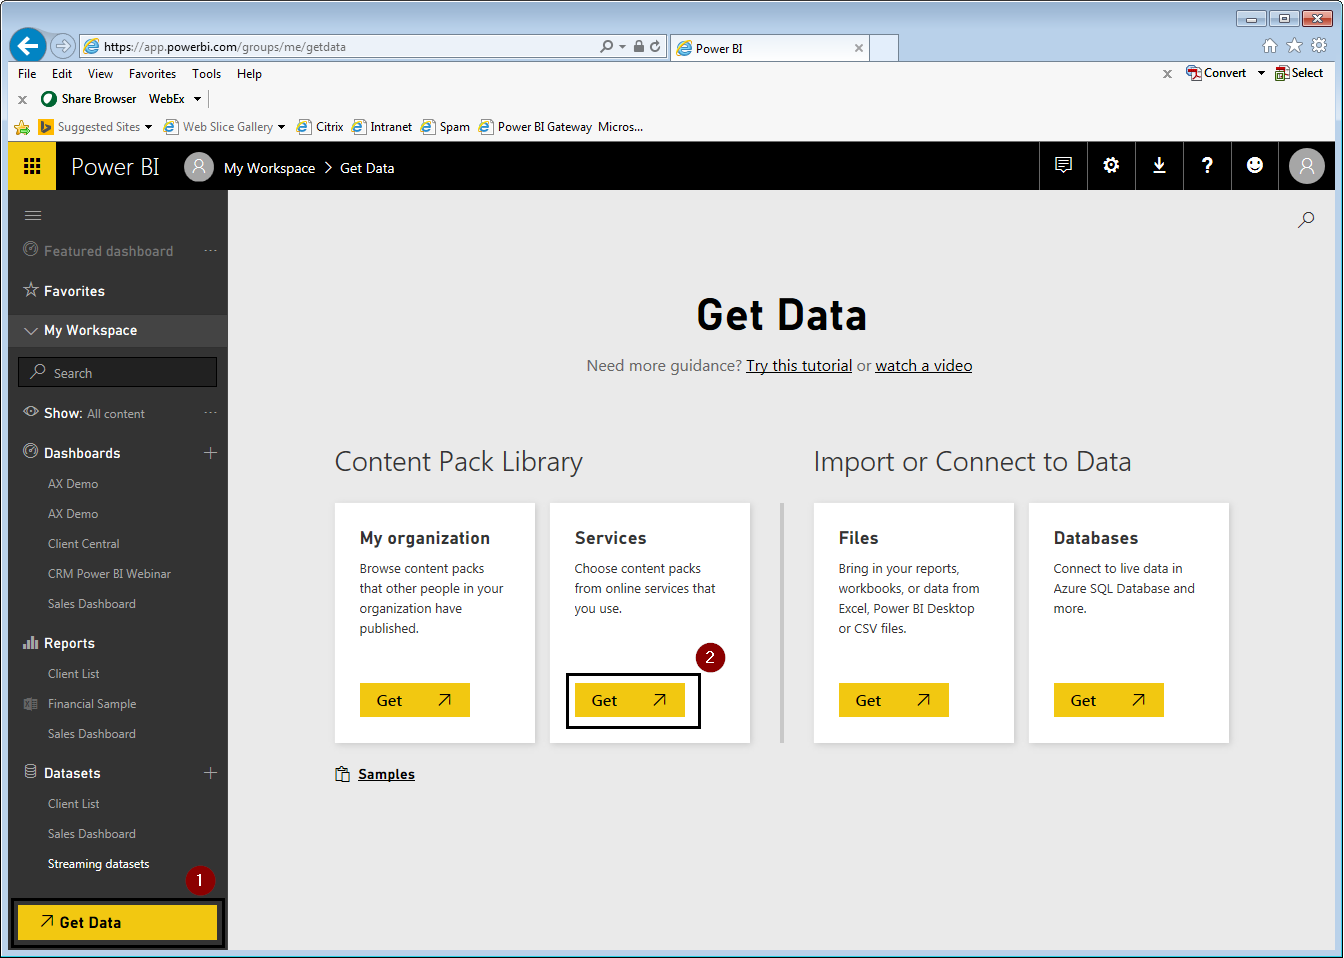
1. In Power BI Service, click on the Get Data option in the navigation bar

2. Under Content Pack Library, click on Services. Below is the screenshot for step #1 and #2.


3. The Power BI AppSource window opens up. Locate your content pack or search for one in the search box.


4. Click on the Get button on the selected content pack. The screen shot below shows a content pack for Microsoft Dynamics CRM.


5. The next dialogue box asks for the service URL as shown below. Enter you Service URL and click next.


6. In the next dialogue box, select the appropriate authentication method (for my CRM Service, I've selected OAuth2) and sign in using your account.


7. Once you sign in, Power BI will establish a connection with your service (in my case, with my CRM Online instance), and will import all the required data. In just a few minutes, all the reports, dashboards, etc. will be ready for use. 

Note: The dataset from the content pack will automatically refresh once a day and you can schedule it to refresh at a particular time (click on the ellipsis next to the dataset and select 'Scheduled Refresh'). You can also refresh the data more frequently than once a day if you have Power BI Pro.

Hope this is helpful. Please leave a comment if you have any questions.

Thursday, November 24, 2016

Power BI Glossary - Terms & Defintions

Power BI
Power BI is a business analytics platform which is built using a collection of tools and services. Primarily, Power BI is a stack of two “companion” applications – Power BI Desktop and Power BI Service.

       Power BI Desktop is a freely downloadable, stand-alone, self-service BI application used to create data models, explore, slice and dice data, create interactive reports & visualizations, and share with other users in the organization by publishing the content to Power BI Service.

      Power BI Service is a cloud application hosted and maintained by Microsoft. Power BI Service provides a platform for business users to share, collaborate and interact with the content created using Power BI Desktop. Not only that, we can also create new reports and visitations using this service. Users would typically interact with the service using a web browser or a mobile device (there are native mobile applications available for windows, iOS, and android devices).

Dataset
A dataset is the data model that is published to the Power Service. Using Power BI Desktop, I can create a data model by extracting data from my data sources (both cloud as well as on-premises), create reports, and publish the document to Power BI Service. The data model from the document shows up under Datasets in Power BI Service. Reports will show up under the Reports section

Visual
A visual is a chart used to represent data in a graphical fashion. As of this writing, Power BI has a total of 27 visuals (and the number is expected to grow).

Tile
A tile is a snapshot of the data (it can be a single visual, or an entire page from a report) which is added (“pinned”) to a dashboard. A tile is added to a dashboard by “pinning” the tile to the dashboard (on each visual, there is a “pin” icon). Tiles are set to auto-refresh every 15 minutes but can be refreshed manually as well. On the dashboard page, if you click the ellipsis (…) on the top right-hand corner, there is an option to “refresh dashboard tiles”.

Report
A Power BI report consists of one or more pages (tabs) with each page containing visualizations, text boxes, images, etc.

Dashboard
A dashboard is created from one or more reports. Let’s suppose I have a report with a few tabs with several visuals on each tab. I can create a dashboard by selecting the visuals I like from each tab and “pinning” those visuals on the dashboard.

I can also create a dashboard by selecting visuals from different reports — this is the beauty of a Power BI dashboard  for example, if I have a report built off of my CRM dataset, and another report built off of my ERP dataset, I can pick visuals from these two reports and have them on a single dashboard. In other words, a dashboard can be created from visuals that belong to different reports and these reports can be from different datasets.

Trivia notes –
1. Visuals in the dashboards can’t be modified; those visuals need to be modified in the report and the changes would automatically reflect in the dashboard.
2.  Also, dashboards don’t have drill-down capabilities (as of this writing). If you think providing drill-down capabilities in a dashboard will be helpful, please vote this idea here https://ideas.powerbi.com/forums/265200-power-bi-ideas/suggestions/7161369-drill-down-in-dashboard

Gateway
Power BI Gateway is an application that connects your on-premises data sources to Power BI Service so you can refresh your reports that are published to Power BI Service. For more information on Power BI Gateway, check out this post  Power BI Gateway

Analyze in Excel
The data sets we publish to Power BI Service can be explored and analyzed using Excel. This feature of Power BI is called Analyze in Excel. If I click on the ellipsis next to the dataset, and click on the option ‘Analyze In Excel’, Power BI will open up the dataset in an Excel pivot table, exposing all the data points in the data model. I can slice and dice by pretty much any field in the data model. Fore more information on this, check out this blog post - Power BI Analyze in Excel

Content Packs
For popular SaaS applications like SalesForce, Dynamics CRM Online, Google Analytics, etc., Microsoft has built a collection of data models, dashboards, and reports and made them available for Power BI users to consume. This pre-packaged collection of data models, dashboards, and reports is called Content Pack. Simply put, Content Packs provide out-of-the-box connectors to popular SaaS applications with prebuilt data model, reports, and dashboards; these dashboards and reports can be customized (“personalized”) if required to fit our own requirements.
For more information on content packs, check this blog post out  Power BI Content Packs

Quick Insights
Quick Insights is a unique feature of Power BI that uses Machine Learning Algorithms to search for patterns in data and provides a list of insights. These insights (visuals) can be saved by pinning them to a dashboard.
To know more about this feature, check this blog post out  Quick Insights In Power BI


Natural Language Query (Power BI Q&A)
Natural Language Query or Q&A is another unique feature of Power BI that lets users ask questions in simple language, and Power BI responds to the questions in the form of a visual. For example, I can ask a question by typing in ‘Show me sales this year vs. last year by product category’. I can also specify filters and visual type in my question. For example, I can type ‘show me sales by customer for the current quarter on a column chart’. These answers (which are visuals) can be saved to a dashboard if needed.

Of course, for this feature to work properly, we’ll need to use the terms and phrases that we have used in our data model. For example, if I ask Power BI ‘show me sales by customer’ but in my data model, customers are named/labeled as accounts, then Power BI Q&A may not provide the expected answer.

Power BI Free vs. Power BI Pro
There are two license types available in Power BI – Power BI Free and Power BI Pro.
·         Power BI Free is free but it lacks some advanced Enterprise features
·         Power BI Pro is $9.99 per user per month and is subscription based
For more information on Power BI pricing and licensing, check this post  Power BI Pricing and Licensing

Sunday, November 20, 2016

What is Power BI Gateway

Power BI Gateway is an application that connects your on-premises data sources to Power BI Service so you can refresh your reports that are published to Power BI Service.
For example, let’s suppose I created a report using Power BI Desktop by extracting data from a SQL Server database which is hosted on my company’s network (on-premises). I then publish this report to Power BI Service so I can share it with other users in the company and also access it using a browser or a mobile device.  If I need to update/refresh the report with latest data, I can open up the report in Power BI Desktop, refresh the data and publish it again to Power BI Service. Of course, this method of manual data refresh is not sustainable so Power BI provides an application (gateway) to automate the process of updating/refreshing data.

There are two types of gateways in Power BI

-      Personal Gateway: Usually installed by a user for individual/personal use. This gateway only services one user. If the user installing the gateway has administrator privileges on the machine, then the gateway is installed as a service, otherwise, the gateway runs an application.

-      Enterprise Gateway: Usually installed on a server by an IT administrator to serve multiple users in the organization. Enterprise Gateway includes more advanced features that are not available in Personal Gateway – for example,  Direct Query to SQL Server,  live connection to Analysis Services, etc.

For both the types of gateways, the computer where the gateway is installed need to be turned on for the refresh to work. If the Personal Gateway was installed with administrator privileges (in which case it is running as a service), then just having the computer turned on is enough; however, if the Personal Gateway was installed using non-administrative privileges (which means it is running as an application), then user need to be logged on to the computer for the refresh to work

Here are some FAQs about Power BI Gateway:
1. Why does Power BI require a gateway to access my data sources that are on premise?
Since the data sources are in your corporate network, Power BI Service can’t access the data sources to be able to update/refresh the reports/dashboards with latest data.

2. Does Power BI require opening up firewall ports to be able to access data?
No. The important thing to note here is that the gateway is installed on one of the computers that are on the corporate network, and it initiates an outbound call to Power BI Service so no inbound ports need to be opened.

3. How does the gateway work for SaaS data sources such as Dynamics CRM Online, SalesForce, etc.?
Since SaaS applications are hosted in the cloud (externally accessible with a valid account), a gateway is not required. Moreover, data sets that use online/cloud data sets such as SalesForce, etc. are updated automatically once a day. You can also manually refresh the data set or schedule a refresh.

4. Is there a way to schedule incremental refresh in Power BI?
No, the refresh in Power BI is a full/complete refresh

5. Do I need Power BI Pro to use Personal gateway?
Yes, both Personal and  Enterprise Gateway require Power BI Pro license to set up the refresh.

6. How do I determine whether I should use Personal Gateway vs. Enterprise Gateway?
If you need the gateway to serve multiple users and want IT to manage the security around which users should have access to which data sources, and need to make sure the refresh works 24/7, then Enterprise Gateway is the way to go. 
Saturday, November 19, 2016

Power BI - Pricing and Licensing

There are two types of licenses available in Power BI - Power BI Free and Power BI Pro.
Power BI Free is free, of course, but it lacks some Enterprise/advanced features.
Power BI Pro is $9.99 per user per month and is subscription based (yearly subscription is required).
Power BI licensing is not based on the role of the user, but rather on the content the user is consuming. For example, like most licensing types, you won’t find a read-only user license or a power-user license. Let’s take a look at the primary components of Power BI and see their license types. As you know, there are main components of Power BI – Power BI Desktop and Power BI Service.
Power BI Desktop is absolutely free. All the features, capabilities of Power BI Desktop are free without any restrictions.
For Power BI Service, the general rule of thumb is that if a user is consuming “pro content”, then they require Power BI Pro else the free version will suffice. Pro content is mainly based on the following 3 factors:
1. Data Refresh - Here are some scenarios that will you help understand when a pro license is needed.
·    Your data source is hosted on-premises, and you are pulling the data into Power BI. If you need to refresh the data automatically, then you'll need Power BI Pro. Please note that data can be refreshed manually, in which case, Power BI Pro is NOT required.
·     Your data source is hosted on premises, and you are querying the data source live (using DirectQuery option). Querying on-premises data sources live requires Power BI Pro.
·    Your data source is hosted in the cloud (for example, you are using Dynamics CRM Online, SalesForce, etc.). You can refresh data once a day using Power BI Free; however, refreshing data more frequently than once a day requires Power BI Pro.
     2. Collaboration - If the report, dashboard, etc. is in a Group Workspace, users will need a pro license to access the report/dashboard. Also, creating organizational content pack requires a pro license.

     3. Security - If the report, dashboard, etc. is using Row Level Security (RLS), users will need a pro license to view the report/dashboard. 

More information on Power BI Pricing can be found here  - https://powerbi.microsoft.com/en-us/pricing/


 Note: If you are using on-premises data sources, you'll need to use Power BI Gateway to refresh the data automatically. 

Wednesday, February 17, 2016

Power BI Desktop issue - More location data is required to create a filled map.

I just ran into this issue while trying to create a 'filled map' visual in Power BI Desktop. The exact error message is:

More location data is required to create a filled map. To create a filled map, the location data should include Bing Map-supported geographic data, such as country/region, state/province, or postal code.

I tried using country, state etc. as suggested in the error message but got the same error. I also tried switching the visual to a regular map - though it didn't throw any errors, it didn't work (won't show any data points etc.) As shown in the screenshot below, I have a column called business_address_01_city in my data model and Power BI desktop doesn't seem to think that this column stores geographic data (even after adding state, country, etc.). 
More location data is required to create a filled map.

So I did some troubleshooting and figured out that there are two ways to address this issue:

1. Have the column names as City, State, ZipCode, etc. This will force Power BI Desktop to think that the columns store geographic data. I acknowledge that this could be an issue if you have more than one City or State fields in the model and/or if you have certain naming conventions you'd like to stick with.

2. Assign the correct Data Category for the column in the Modeling tab as shown in the screenshot below. For example, if there is a column called business_address_01_country in the data model, select the column and change the Data Category to Country and Power BI Desktop will understand that this column has geographic data.


I hope this is helpful. If anyone has another solution they used to resolve this issue, please let me know by posting a note in the comments.